 The Author: Anne Golombek
Anne Golombek is COO and Marketing Lead at minubo, the Commerce Intelligence Company. As an expert in data-driven commerce, she is one of the initiators of the Commerce Reporting Standard project.
In Cooperation With: Thomas Korn, Otto Group
After having introduced the Business Vitality Model and its added value in article 1 as well as having outlined the details of the underlying considerations and calculations in article 2, we’ll now take a closer look at how you can reach next level. For that, we’ll split up our reflections into four main parts:
- Plan: Forecasting & sensitivity analysis
- Evaluate: Three ways of benchmarking
- Simulate: Scenario analysis
- Act: Breakdown to operational level
1) Plan: Forecasting & Sensitivity Analysis
In our first two articles, we saw how a business vitality analysis of past and current performance can change the perception you have of how your business is doing. Another good thing about precise analyses of historical patterns is that you can directly continue them for forecasting purposes. The Business Vitality Model is particularly well-suited for that as well as for making the expected impact of strategic measures visible, as its cohort-based structure makes key drivers and their development a lot more transparent than other analytical models do.
Find the Right Statistical Approach
Depending on the historical patterns, you can use different statistical approaches to forecast the development of your key drivers. Of course, it might take some time to figure out the best way to do so for your own business. For example, it might be easier to use relative churn rates to forecast retention rates, as relative churn rates account for (guess what) the churn and therefore the shrinking values in older cohorts year-on-year.
Driver Sensitivity
You will also start to gain insights into how sensitive the different drivers react to changes in your growth rates. Depending on your business model, the stability of drivers can be a bit frustrating as well: Best example for that is the purchase frequency per year which is ‘flat like Kansas’, if you are running a mature business. But it’s actually here where the real value-delivering discussions start to emerge.
You also need to be aware that you are dealing with an integrated system, so if you play around with the data, you need to be aware that changing one driver changes the sensitivity of the other drivers as well. We would always recommend to manipulate the quality drivers first (basket size and frequency) to then look at the development of payback as well as at how much you can afford in regard to investments in your customer base (a.k.a. marketing budget). Finally, you estimate the changes in your customer base (CAC, retention rate) and get a clear picture of your business case.
Keep Complexity in Check
As cool as it can be to forecast on the cohort level – stay aware of the inherent complexity. While you might be deeply in love with your data and the smartest statistical methods, you might need to explain your thoughts to other people – especially, if you deal with more than one model (e.g. different markets). That’s why it’s recommended to assess value add of cohort level forecasting to averages. Simply try both approaches and go for the simpler method, if there are not too much deviations. You can also introduce a two-layered approach: Build a high-level model that runs on averages, but have every average powered by the cohorts on 2nd level. You will then be able to drill down into your data in case you have trouble to explain the development of your average values on the 1st level.
In the end, you need as much data as possible, so having access to benchmark data as well as developing rules of thumb can add real value to your model.
2) Evaluate: Three Ways of Benchmarking
The actual power of the Business Vitality Model is unlocked when you start comparing your data to others. That means: Changing from the company perspective to the KPI perspective. Basically, there are three ways of benchmarking within the BVM:
- Absolute values
- Ratios
- Growth over time
Absolut Values
They are what comes to mind first – absolute values:
- How high are retention rates in t+1 compared to other companies?
- How much do companies spend per new customer acquisition?
- …
Of course, all companies are different and, in many cases define their metrics differently – and, of course, benchmarking works best, if everyone talks about the same thing. The resulting questions of harmonization resp. standardization are among the main reasons we brought our Commerce Reporting Standard initiative into being. You can see our first results on the standardization of transaction metrics here.
Ratios
They are what provides guidance / stability within our model – ratios:
- What is the share of new customers?
- How high is the CAC for new customers vs. marketing spend for existing customers?
You can use ratios to balance your model and double-check if your forecasting stays in line with some rules of thumb. Some examples:
- Don’t spend more on existing customers, if they don’t clearly outperform your new customers.
- The share of new customers from the total customer base normally ranges from 25%-35% in a stable model. If you need to newly acquire more than half of your customer base, you have a clear stickiness issue and might not be around for so long.
Growth over time
Although absolute values and ratios are already cool stuff to work with in terms of benchmarking, the real fun starts when you become able to compare growth rates across companies. When you then add the time perspective, you can get really amazing insights into what GAFA does to eCom businesses (e.g. decreasing purchase frequency growth rates over time). Also, you will be able to identify maximum growth rates per driver per year and get more guidance for your forecasting.
Using the same methodology and benchmarks, you can also start exchanging best practices on key strategic measures – discussing questions like ‘What has increased the growth of your customers’ purchase frequency over the last years the most’. This is when the BVM analysis starts to earn you actual money.
3) Simulate: Scenario Analysis
After having done some forecasting as well as having added some know-how from benchmarks, it’s now time to think about scenario analysis. Again, you can go crazy and create complex models and many different scenarios, but still, we recommend to reduce complexity where possible. For starters, you could create a baseline case that includes all negative trends / “no hope” and serves you as the lower bound of your forecast. You can do this for all drivers, but especially the development of your customer base, your revenue and gross profit should be looked at in detail.
The Importance of Clear Rules
To build sound scenario analyses, it’s important to implement clear rules. For example, the creation of a baseline case could mean to freeze marketing budget YOY and to lose some marketing efficiency which leads to less customers per invested dollar. With this baseline given, you need to define strategic key measures that will improve your baseline case. The added value of all key measures brings you to the ambition level that hopefully is in line with your strategic top-down forecasting case.
To get a better understanding of the scenarios, you can compare their core assumptions as well as work with visualization again. In the example, you can see the natural development of the customer base which slowly starts to stagnate while in the ambitious top-down case you restart revenue growth and even plan to accelerate it beyond 2020.
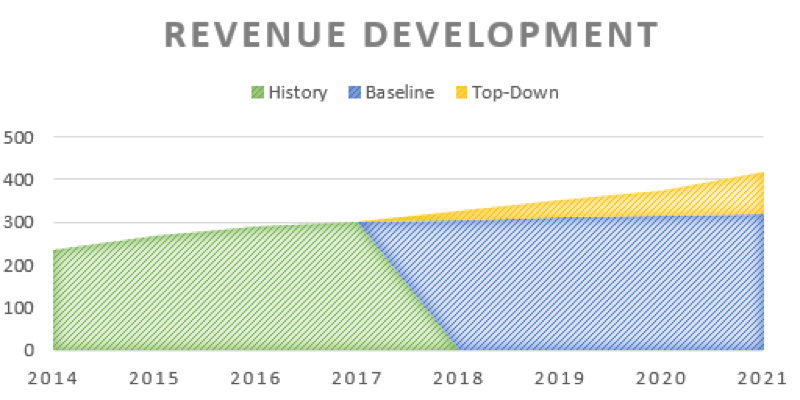
Sample Scenario Analysis
4) Act: Breakdown to Operational Level
When it finally comes from strategic planning to operational implementation, you’ll always need a calculative bridge to connect both levels. The Business Vitality Model is a nice basis for this, as you can break it down to all kinds of metrics – deep-diving into various operational business areas (e.g. shopping cart analysis, customer acquisition cost vs. lifetime value…), so derivation of operational goals and measures becomes an easier task.
Bridge the Gap
For starters, it is recommended to add a monthly perspective to your cohorts that lets you calculate CLVs and core ratios (cumulated gross profit / invested capital) on a cohort level. This way, you get a direct connection to the performance of your marketing. From there, you then can enter the world of marketing attribution and can go nuts on channel allocation and purchase sequence analysis as well as identifying influencing factors of your model and still avoid the danger of getting lost on the operational level – the derived values from the BVM will guide you.
Of course, you can implement large marketing suits and go for ‘real-time CLV’ & Co, but for most businesses it is enough to work with rule of thumbs derived from your models while updating your model will increase your skill level and know-how step by step.
Now, it’s Your Turn!
First: Discuss With us – Online or in our Workshop!
What do you think about these ideas? Don’t hesitate to share your thoughts – via the comment section below or in person during our workshop about the Business Vitality Model:
November 8th, 2018 – 10am–5pm
Project A offices, Berlin

Second: Have Your Own Business Analyzed!
What do your own numbers have to tell you? We offer to run the Business Vitality Model for you – first two signups get the analysis for free! Just register via our form and we’ll get in touch with you shortly.