 The Author: Anne Golombek
Anne Golombek is COO and Marketing Lead at minubo, the Commerce Intelligence Company. As an expert in data-driven commerce, she is one of the initiators of the Commerce Reporting Standard project.
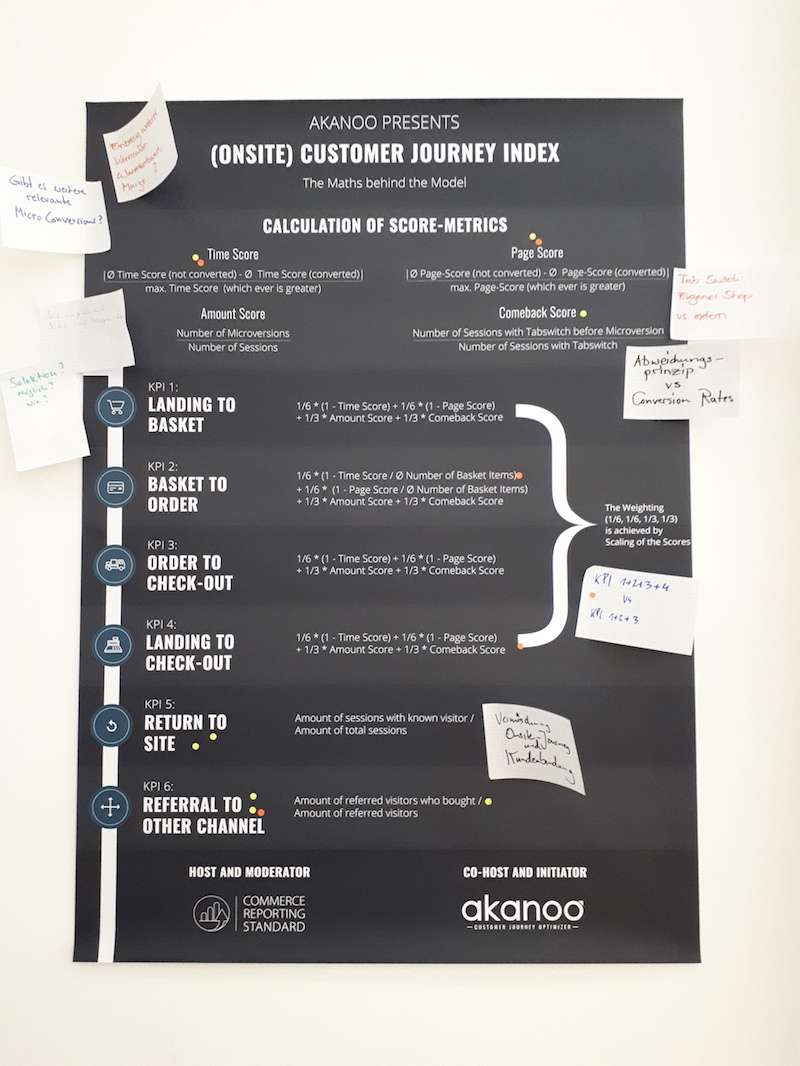
On Thursday, June 21st, another CRS workshop turned out to hold a great deal of insight for all participants: CRS community members from companies like baumarkt direkt, REWE vertical ZooRoyal, Händlerbund, mindlab and of course minubo and Akanoo put their heads together and spent a day full of in-depth discussions on how to get hold of customers’ onsite behaviour – specifically: on the Onsite Customer Journey Index model developed and presented by Akanoo. In this article, we’ll share a high-level overview on the most important discussion topics.
Balance Simplicity Against Validity
One of the key questions during the workshop (and probably one of the key questions in every development process of index models) was the balancing of model simplicity against maximization of model validity down to very granular levels of detail. Basically, there are two variants: Should the CJI be an index that “only” provides an overall feeling of how a company is performing in terms of its customers’ onsite journeys – and, through its simplicity, allows easy adoption by a broad audience? Or should it be an index that is very accurate in its explanatory power on all levels – but, with that, relies on data points that are quite hard to obtain for most companies? The original idea of Akanoo tends towards the first variant, and also in the workshop, we tended towards the conclusion that, in the first step, a version that allows broad benchmarking might be the better direction to take.
Actually, the discussions showed, that even with that given, there might still be problems in data collection with the current calculation approach that already strives to be as simple as possible: E.g. timestamps for single events (microversions) that are required to determine time on site for the single journey sections in KPI 1-4 are usually only to be found in the raw data of web tracking systems, not in the frontends. So the question remains: Is this easy enough to allow mass adoption? In the course of that, we also covered the idea of bringing the CJI model to web tracking system providers who have the needed data and can display them in their frontends – with a go-to-market approach like this, adoption should become a lot easier for users.
Deviation as Strong Strategy to Calculate Valid Score Values
Fast consensus has been achieved in regard to the chosen approach to build Time Score and Page Score on the deviation between converting and non-converting users – not on absolute numbers. Thus, there is no evaluation made, if short/long Time on Site and high/low Number of Page Views are either good or bad – what counts is the difference between conversions and non-conversions, so journey sections with high deviations can be identified as sections with high potential for improvement. This way, the calculation method keeps validity for various differing business models.
Consideration of Bounces and Customers Without any Microversion
One problem that could be identified is the fact that users without any microversion are not considered in the model so far, as the first KPI only takes values into account that are calculated for users who put something in the basket (first microversion). Anyone who doesn’t, doesn’t show up in the model, though these users tend to be a highly relevant group for most online retailers (a 20-40% bounce rate is normal for many businesses – and its even not only bounces we talk about here). The solution seems to be an additional KPI that is all about this user group: KPI 0 – maybe something like “Landing to Leaving”?
Another problem that comes into play here is the fact that Time on Site is a highly problematic metric in almost every use case. It’s always inaccurate, as you cannot measure Time on Site for the last visited page – and thus, you don’t ever even have any actually measured Time on Site for bounces. Most web tracking systems work with standardized values for this case – what allows calculation, but compromises comparability between companies as not every web tracking system uses the same standard values. This issue will become all the more relevant when it comes to defining KPI 0.
From Page Score to Interaction Score
Another difficulty is given through the fact that online shops can be implemented in a wide variety of ways – some shops implement every interaction (e.g. setting a filter) as a new page view – others load content dynamically. Therefore, systems with a high rate of dynamic loading might show Number of Page Views = 1 for multiple users with widely differing behaviour, so differences between converting and not converting users might not even be measured. This insight led to the opinion that it might be a good idea to measure defined events instead of page views – and summarize these events in some kind of “Interaction Score” instead of the “Page Score” that is defined so far. (Of course, event tracking is somewhat trickier than page view tracking, as it has to be set up and maintained manually – what brings us back to topic one…)
Rethink Calculative Inclusion of Ø Number of Basket Items
In the original version, Ø Number of Basket Items (relevant for the evaluation of the journey section “Basket to Order”, as time and page views strongly vary depending on how much a user puts into his or her basket) are directly included into the formula: 1/6 * (1 – Time Score / Ø Number of Basket Items) + 1/6 * (1 – Page Score / Ø Number of Basket Items) + 1/3 * Amount Score + 1/3 * Comeback Score. An alternative approach would be to include Ø Number of Basket Items into Time Score and Page Score for KPI 2 or even build a separate Score value for it. Consensus of the workshop participants was that the explanatory power of KPI 2 would probably reach a maximum with a separate Basket Score – calculated like Time Score and Page Score, as, again, the big advantage of this approach is that it doesn’t evaluate if high or low absolute numbers are a good or a bad thing. Also, the calculatory relation of Time Score/Page Score to Basket Score would probably be a “cleaner” one to calculate with than the current calculatory relation of Time/Page Score to absolute Ø Number of Basket Items.
Differentiation Across Various Attributes
A huge discussion topic has been differentiation of all kinds. The most important attributes to consider seemed to be the following ones:
- Industry / type of business model: Of course, user behaviour can strongly vary between different industries and business models. B2B web shops will have different kinds of user journeys than B2C web shops – just as shops selling food will have different ones than shops selling furniture. Thus, it will be an important step to allow companies to benchmark themselves to companies from the same group of industries and business models.
- Customer type (new/existing): For customer type, differentiation is important to maximize insight for different questions within the same company: 1) Does our shop work for new customers who are not used to it yet? Do they find what they’re looking for easy and fast enough? 2) Is our shop suited to retain customers as they know they’ll be able to get their products in a way that’s fast and comfortable and, ideally, makes them feel welcomed and appreciated as old acquaintances?
- User intent: As user behaviour can strongly vary with a user’s intent during his or her website visit (e.g. buying intent, research intent, service intent, product types (e.g. dog food vs. new aquarium…), it could become crucial to differentiate between them – for some shops more than for others. One remaining question: Is this mainly relevant for analytical questions within the company or should differentiation be considered for benchmark definition as well?
Alternative KPI Portfolio: Limitation to Journey Section KPIs
One central workshop topic has been the overall KPI portfolio of the CJI. Wouldn’t its explanatory power be higher, if it would only consist of the KPIs based on the single journey sections? This way, the model would be far more focussed (on the very specific topic of the onsite funnel) – not trying to solve multiple issues at once. The three main aspects that led to this discussion were the following ones: 1) Isn’t KPI 5 more about customer retention than about onsite user behaviour? 2) Is KPI 6 really relevant and (most of all) actually measurable for a considerable number of online retailers? Isn’t this aspect more about another analytical question than the onsite funnel – just as KPI 5? 3) Wouldn’t the total star evaluation (average of all single-KPI values) make more sense, if the underlying KPIs were more homogenous – like KPI 1-4/KPI 1-3 are?
Further Discussion Topics
Of course, that’s not all the aspects we covered – here are some more of our discussion topics that should complete the picture of how this workshop went:
- KPI Portfolio: Should KPI 4 as kind of a summary of KPI 1-3 really be part of the model – especially when KPI 0 is added (see above)? So far, the only added value of KPI 4 is the fact that it includes bounces and non-converters, which KPI 1-3 don’t. As these would be covered with KPI 0, KPI 4 might become fully redundant.
- Terminology: Reflect on names of KPIs, basic metrics and scores to leverage existing web analytics terminology (e.g. “Number of Sessions” for “Amount”)
- Terminology: Avoid deviating usage of terminology that is already established in other contexts (e.g. “Return Rate”)
- Terminology: Is “Onsite Customer Journey Index” the right name in regard to sthe insights the model delivers? Might “Funnel Index” / “Onsite Funnel Index” be a better name?
- Comparability: The fact that KPI 6 (Referral to Other Channel) is not valid for every business limits comparability
- Comeback Score: Is this actually a relevant indicator of onsite performance in this context?
- Comeback Score: The fact that there’s no differentiation between external and internal tab switches (other web pages/own web shop) compromises validity of Comeback Score
- Basic Metrics: Would it make sense to include value metrics into calculation (basket/order values, contribution margins…)?
- Weighting: Could the weighting approach (1/6 + 1/6 + 1/3+ 1/3) be improved?
- Weighting: Should the two kinds of factors be accounted for separately (weighting and normalization)?
- Basket Setup: Differentiate between active basket setup (customer puts items into basket) and passive basket setup (basket is automatically restored from previous session)
- Built-in Conversion Preventers: Consider built-in conversion preventers like “new customers can only place orders worth less than 1.000 Euros”.
- Action: How can the model best be used to derive concrete action to take (strategic and operational)?
That’s it so far! Thank you again to everyone who participated and gave their input to these valuable discussions – and thank you most of all to Akanoo for their blog posts and their part of workshop preparations.
If you have any questions or feedback on the Onsite Customer Journey (CJI) and how we covered it here at the Commerce Reporting Standard (CRS) platform, just leave a comment via the form below or contact us directly:
CJI: cji@akanoo.com
CRS: contact@commerce-reporting.com
…and maybe you want to be part of the next CRS workshop? Just sign up for the CRS newsletter to stay up to date on new topics and upcoming workshops!