 The Author: Anne Golombek
Anne Golombek is COO and Marketing Lead at minubo, the Commerce Intelligence Company. As an expert in data-driven commerce, she is one of the initiators of the Commerce Reporting Standard project.
In our latest blog posts, we covered two basic topics around transaction metrics: 1) the systematization of the metrics themselves and 2) the logic of time references applied to calculate those metrics. Now, to complete the picture of systemizing this first block of metrics, let’s take a look at the missing pieces: rates and averages. Sounds like quite a simple matter, right? But who’d have thought: If you get into it and try to establish a set of sound metrics, you get into trouble quite quickly. But let’s take one at a time, starting with the averages for this article.
The Challenge
Everybody knows how averages work: You take a certain amount of values or quantities, add them up, and divide them by the number of values/quantities you cumulated (the “certain amount” from before). Put together in a formula, averages look like this:
ø Value = (Value 1 + Value 2 + value 3 + … + Value n) / n
If we look at transaction metrics now, there are two key aspects which make calculating their averages so difficult:
- There is a huge amount of transactions metrics
- There also is a certain amount of levels to be considered for average calculation (“level” means average per X – e.g. ø Order Value per Order vs. ø Order Value per Item etc.)
In total, these premises result in one major challenge we face when looking at transactional average metrics: There is a huge amount of average metrics that can be calculated from all those values, quantities and levels! The key question: Which of those are actually relevant?
To approach the answer to that question, let’s start with building a solid systematization of transactional average metrics to then select the most relevant ones.
Value Averages: Basic Systematization
To build a basic systematization of transactional average metrics, let’s start with the example of one value level line from our Transaction Metrics Matrix: the Order Value line (all values of that line across all quantity levels from orders to net sales: Order Value – Open Order Value – Cancelled Order Value – Revenue – Returned Revenue – Net Revenue). To get to the basic systematization, we distribute the various quantity levels and modifiers across two axes representing numerator and denominator of the fraction we need to calculate an average. In so doing, we get the following overview:
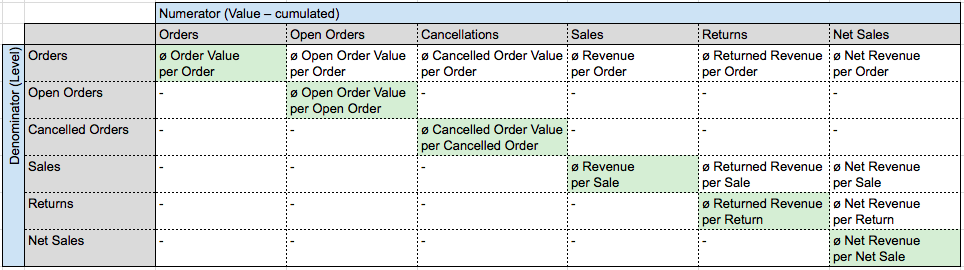
Matrix 1: Basic Systematization
As not all theoretically possible calculations make actual sense, we don’t fill the matrix completely (example: “Average Open Order Value per Return” isn’t something that actually exists). Also, we highlight what we think are the actually relevant average metrics from this matrix – that is: the diagonal running from the top left to the bottom right corner.
Value Averages: Extended Systematization
Based on the premise that only the highlighted metrics on the diagonal are actually relevant, we can make the systematization more compact by merging the two axes (so we’ll only keep the highlighted diagonal) and, in the same merged form, add a further set of levels that are crucial for working with transactional average metrics. Those are: averages per order/invoice/return/net invoice line, per SKU in orders/sales/returns/net sales, per product in orders/sales/returns/net sales and per item ordered/sold/returned/sold net.
Note: To keep things as compact as possible in order to be able to really focus on the systematization, we’ll leave out the Open Order Value column as well as the Cancellations column from now on as they only have little practical value in terms of average metrics (at least in the context of transactional analysis – e.g. open orders become more relevant in terms of fulfillment). As soon as it comes to publishing a full list of metrics, we’ll reintegrate those averages, of course.
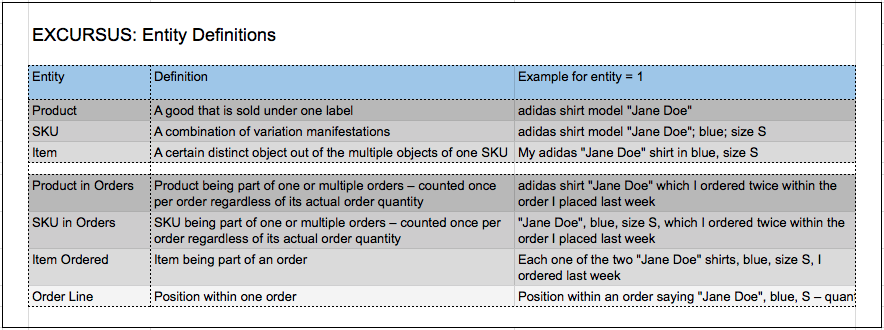
Excursus: Entity Definitions
The resulting systematization is then as follows (with the relevant metrics from Matrix 1 highlighted in green and the recurring y-axis specifying the metric’s denominator according to its corresponding step in the transactional process):
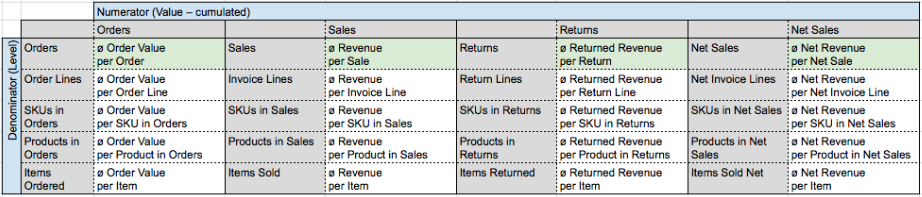
Matrix 2: Extended Systematization
Now, we have a systematization that is cleaned up from dispensable clutter, but still has three blind spots that have to be taken care of:
- Some of the names still contain redundant elements given the fact that the premises of the systematization already hold certain information that don’t have to be repeated in the metric’s name (e.g. “Invoice Line” is redundant in “ø Revenue per Invoice Line” once you commit to the fact that only the diagonal from our original matrix (Matrix 1) is relevant for metric calculation. If you do commit to that, you can shorten the name to “ø Revenue per Line” without becoming ambiguous. The same goes for “ø Order Value per Order”, “ø Revenue per Sale” etc. which can be simplified to “ø Order Value”, “ø Revenue” and so on).
- Products in Orders is an evaluation level that is not very relevant for most business models, so we will leave that aspect aside for the further steps in our systematization.
- The line level and the SKU in orders level will conflict with each other in most cases, so they deserve some more thought. Let’s take a closer look at this:
How to Measure Averages per Position: Order Lines vs. SKUs in Orders
The problem we face here is actually a problem of data collection, not of evaluation. The question that you as a commerce company probably ask yourself is: “What is my average per order line?”. What you actually want to know, though, is probably something else: “What is my average per order line – provided that every ordered SKU is bundled in one order line to make sure I get clean and insightful numbers”. Unfortunately, in our experience, this isn’t always the case. What usually happens is that you find multiple sets of orders looking like this:
Sample Set of Order Lines
Sample Product: X; GMV: 10€
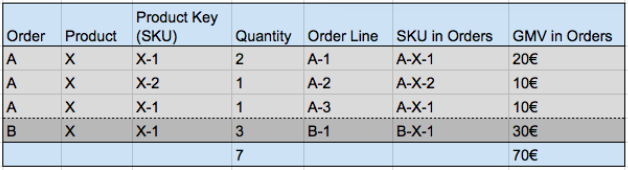
Sample Set of Orders
ø GMV per Order: 70€ / 2 = 35 €
ø GMV per Order Line: 70€ / 4 = 17,50€
ø GMV per SKU in Orders: 70€ / 3 = 23,30€
ø GMV per Item Ordered: 70€ / 7 = 10€
ø GMV per Product in Orders: 70€ / 1 = 70€
In this example, you see that Order Line A-3 is not recorded correctly – the ordered quantity of SKU X-1 should be part of order line A-1. As, in this case, the number you want to see in your reporting when you ask “What’s my average GMV per order line?” would probably be 23,30€, not 17,50 €, we say it’s the best way to always base per order line calculations on SKU in Orders directly – naming the metrics “ø X per Line” nevertheless as this can be presumed as people’s knowledge interest and is easier to understand than “ø X per SKU in Orders”.
Value Averages: Refined Systematization
With our answers to the three blind spots (1. shortening of names; 2. omission of Products in Orders; 3. merging of SKUs in Orders and Order Lines), we now get the following matrix as a result (with the relevant metrics highlighted in green):
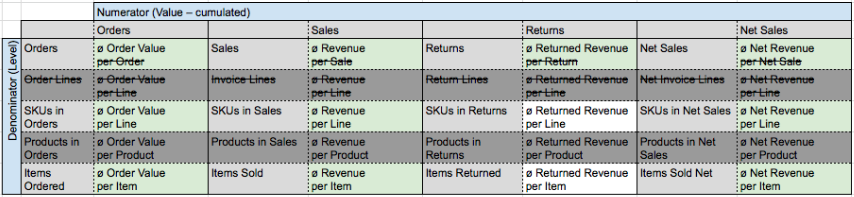
Matrix 3: Refined Systematization – Intermediate Step
Matrix 3: Refined Systematization – Result
That looks fine, doesn’t it? Still, we have one step left to go with value averages as this is just a sample systematization with the example of one single value level from the Transaction Metrics Matrix, remember…?
Value Averages: Full Systematization
So what we do now is simply to break down each value metric’s averages across all three denominator levels and all four numerator levels to get to the full systematization of transactional average metrics. With that, again, we spare the metrics which wouldn’t make that much sense (or wouldn’t hold actual business value – like e.g. ø Markdown in Returns per Line). Also, within all those logically useful metrics, we highlighted the generally relevant ones (light green) as well as the most relevant ones (dark green):
- Light green – generally relevant metrics: All averages calculated on Order level plus all averages calculated on SKU in Orders level and Items Ordered level for all metrics of the central Order Value line
- Dark green – most relevant metrics (not considering company types or employee roles at this point): All averages analogous to the Revenue Cascade / Breakeven Analysis from our Transaction Metrics Matrix (marked by the red box) – so the key average metrics ultimately correspond to our key value metrics.
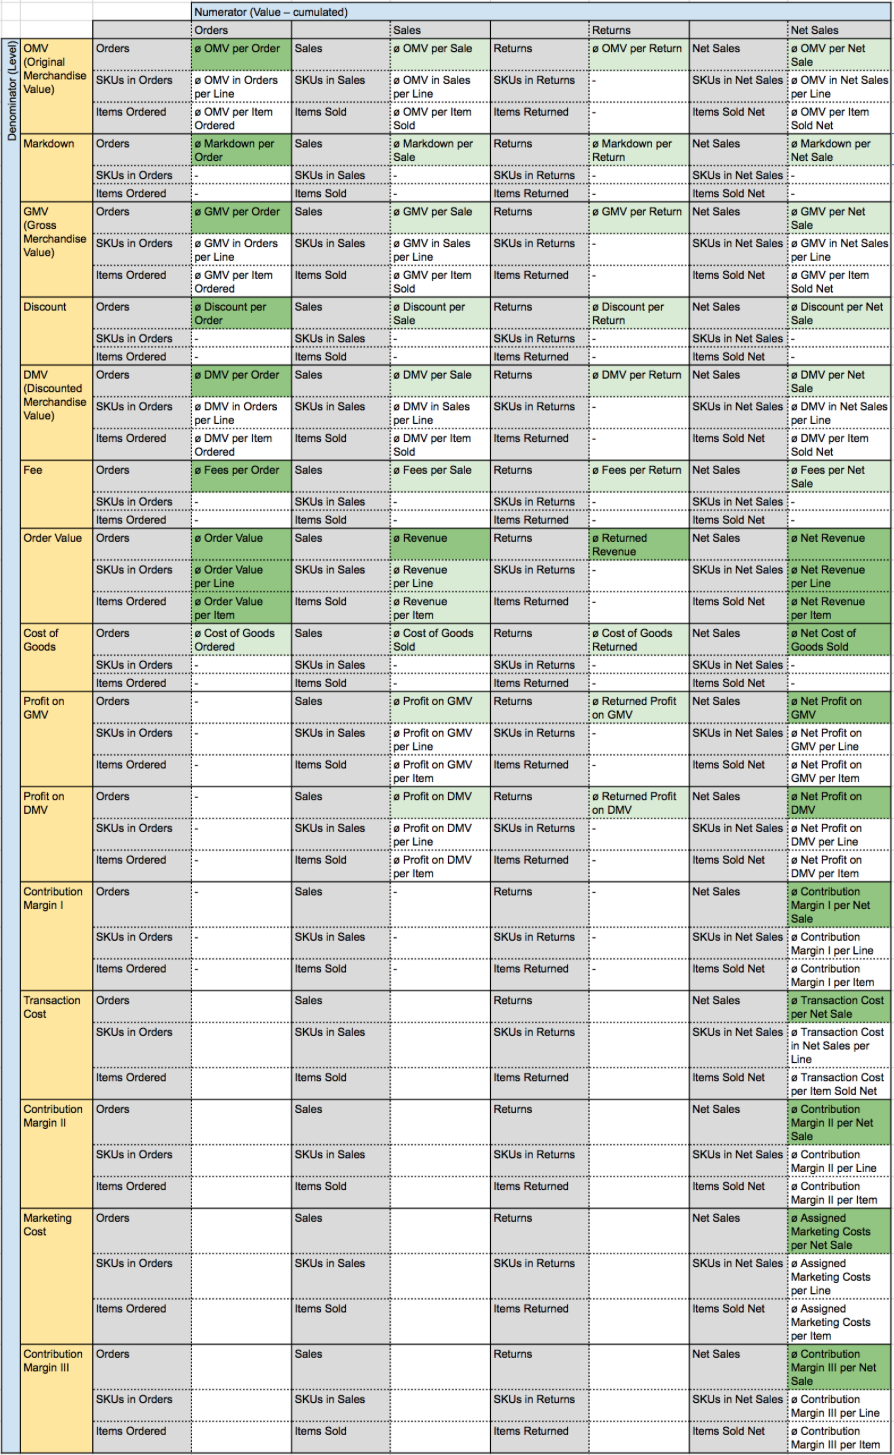
Matrix 4: Full Systematization
Not the right language for you?
![]() View German Value Averages Overview
View German Value Averages Overview
Quantity Averages: That’s Easy
Wow, still not the end with that topic? No, unfortunately, we still haven’t touched the second averages block at all: the averages of our quantity metrics. But, what luck!, that’s not really complicated as there are not that many quantity metrics in the transaction metrics block after all. Here they are with the same systematization as applied to the value metrics:
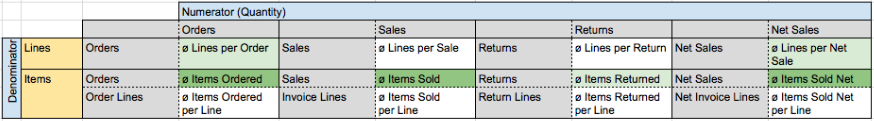
Matrix 5: Quantity Averages
Not the right language for you?
![]() View German Quantity Averages Overview
View German Quantity Averages Overview
(That was easy, right?)
A Final Word…
Unfortunately, that’s still not quite the end. In the last article, we had a look at time references for transaction metrics and how they multiply the total number of metrics by a certain factor, as all metrics on sales level, on return level and on net sales level can be calculated based on two kinds of time references each (Sales: Order Date, Invoice Date; Returns: Order Date, Return Date; Net Sales: Order Date, Invoice Date/Return Date). Of course, this is also valid for our averages, so ultimately you would have to superimpose the following support table on the full systematization matrix (or to be more exact: the metrics that are considered most relevant):
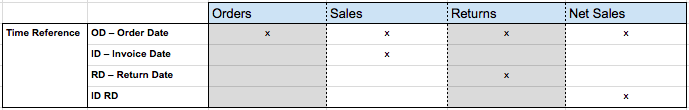
Support Table: Time References
What is Your Opinion?
That certainly was a complex topic with a lot of potential for discussion. So: what is your opinion on this? Which transactional average metrics do you consider most important or are you used to work with? We’re looking forward to your comments!