 The Author: Anne Golombek
Anne Golombek is COO and Marketing Lead at minubo, the Commerce Intelligence Company. As an expert in data-driven commerce, she is one of the initiators of the Commerce Reporting Standard project.
Transaction Metrics are the very core of every reporting done in commerce companies. They answer the most important business questions: How much did we sell? How many returns came in? How much revenue did we generate and with what margin? So to get the basics straight from day 1, we’ll start our work at the commerce reporting standard with exactly that topic.
The Transaction Metrics Matrix
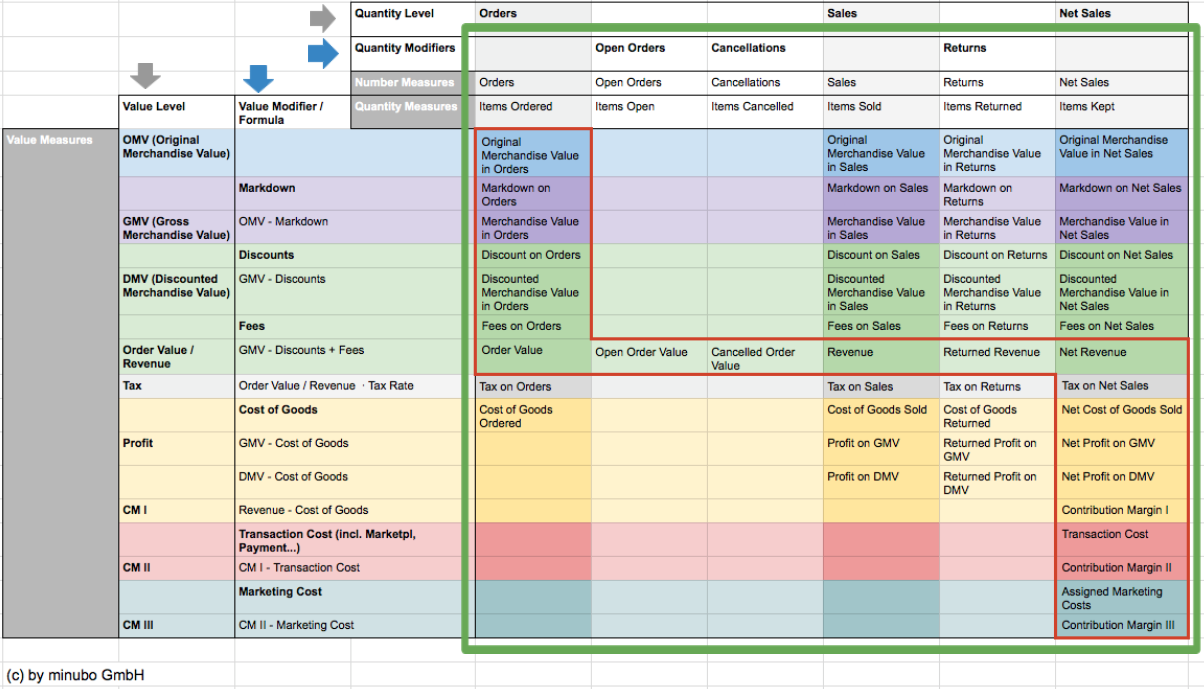
At minubo, we systematized transaction metrics for our commerce analytics data model years ago. We did this with the help of a matrix to not only list the metrics, but show their logical connection and calculation. Here it is:
Not the right language for you?
![]() View German Transaction Metrics Matrix
View German Transaction Metrics Matrix
Yes, I know, it looks complicated. But actually, it is quite simple, though. This is how it’s build:
Main Levels & Modifiers – Rows & Columns
- Value levels & modifiers (rows): The value levels of the matrix comprise all value-based components that transactions can be broken down into – from Original Merchandise Value down to Contribution Margin 3. Those value levels are influenced by value modifiers like markdowns, discounts or marketing costs: They define the relationships between the single levels (e.g. Gross Merchandise Value minus Discounts results in Discounted Merchandise Value).
- Quantity levels & modifiers (columns): The quantity levels of the matrix comprise all quantity-based components that transactions can be broken down into – from orders down to net sales. Those quantity levels are modified by quantity modifiers like cancellations or returns: They define the relationships between the single levels (e.g. Sales minus Returns result in Net Sales).
Resulting Groups of Metrics
Rows and columns combined result in three groups of metrics (surrounded by the green box): number metrics, quantity metrics and – for the most part – value metrics.
- Number metrics (top): The number metrics give a high-level overview on transactions at their quantity level: Number of Orders, Open Orders, Cancellations, Sales, Returns, Net Sales.
- Quantity metrics (2nd from top): The quantity metrics break the pure transaction numbers down into item quantities that are included in those transactions: Items Ordered, Items Open, Items Cancelled, Items Sold, Items Returned, Items Kept.
- Value metrics (biggest block): The value metrics finally show the value that’s behind the transactions regarding all their components combined from the various value levels/modifiers and number values/modifiers: e.g. Original Merchandise Value in Orders, Markdown on Sales or Discounted Merchandise Value in Net Sales.
The Core: The Revenue Cascade // Breakeven Analysis
Within the value metrics, there is a set of core metrics that can be isolated from the complementing ones in terms of reporting priority: the so-called revenue cascade or breakeven analysis metrics (surrounded by the red box). Those metrics combine value and quantity levels/modifiers in a logical order that is well-suited to analyze a great variety of transaction-related processes. Therefore, commerce organizations should be able to break this cascade down across multiple entities and dimensions: Products and categories, customers and customer segments, countries, time periods and more. This does already provide great insights on business performance on multiple levels. The question of which entities and dimensions this should be will be part of another discussion (see disclaimer below).
Disclaimer
Before we start, let’s clarify two last things:
- Dimensions: Of course, all the questions mentioned in the first paragraph have to be complemented with some kind of dimension at some point: How much did we sell last month? How many returns came in from new customers? How much revenue and margin did we generate per product category? But to not overcharge this already quite complex topic, we’ll leave this aside for now and make the dimension topic part of another discussion.
- Rates and averages: The pure figures shown above are not the only metrics that are relevant with the transaction metrics block – they have to be complemented with their rates and averages. Those are not part of the introduced matrix as they will be discussed separately as well.
Discuss With us!
Now it’s time to dive into our very first Commerce Reporting Standard discussion! Use the comments form to tell us what you think about our systematization of transaction metrics. Do you handle transaction metrics in a similar way? Are there major differences to the best practices that you know and are positive about? Let’s discuss!


Which costs can Transaction Costs contain?
Hi Peter,
thanks a lot for your comment!
We suggest to define transaction cost as all costs that are directly related to the transaction and have been generated by a third party provider. Accordingly, those can e.g. be marketplace costs, costs for payment or shopping cart providers, costs for fulfillment (also return handling costs) and so on. Excluded from that are, on the one hand, general internal expenses like personnel costs or rental costs (which are deducted for calculation of contribution margin 4 which, as a purely financial metric, is not part of our transaction metrics model) and, on the other hand, marketing costs which are already deducted for calculation of contribution margin 2.
What do you think about that definition?
Best
Anne
Hi Anne,
I agree with your definition. The only objection I have is that in my opinion marketplace costs are marketing costs. Otherwise, you can have marketing costs on Amazon, eBay etc. too (Advertising spendings). To keep it short: I have no better solution for this, as your definition.